Generating Data Clarity for ESB
ESB Real Time Visualisation App
CLIENT
ESB Generation & Trading

INDUSTRY
Utility

TECHNOLOGIES
- HTML 5
- CSS3
- Google Maps
- Google Charts
- API Data Config
- Asp .Net Core
- .Net Framework:
.Net Core 2.1
- Visual Studio 2019
- SQL Server
- Management Studio
Postman
LAB+ DELIVERABLES
- User Research
- Digital Brand Guidelines
- User Experience Design
- User Interface Design
CRAFT DELIVERABLES
- Art Direction
- Prototypes

BUILD DELIVERABLES
- Front-End Design
- Product Management
- Product Development and Deployment
- UAT and QA

AWARDS
- UX Design Awards
  Best Product
- IDI Awards 2023
  Best Data Visualisation Design
- Microsoft
  Globally Benchmarked
Overview
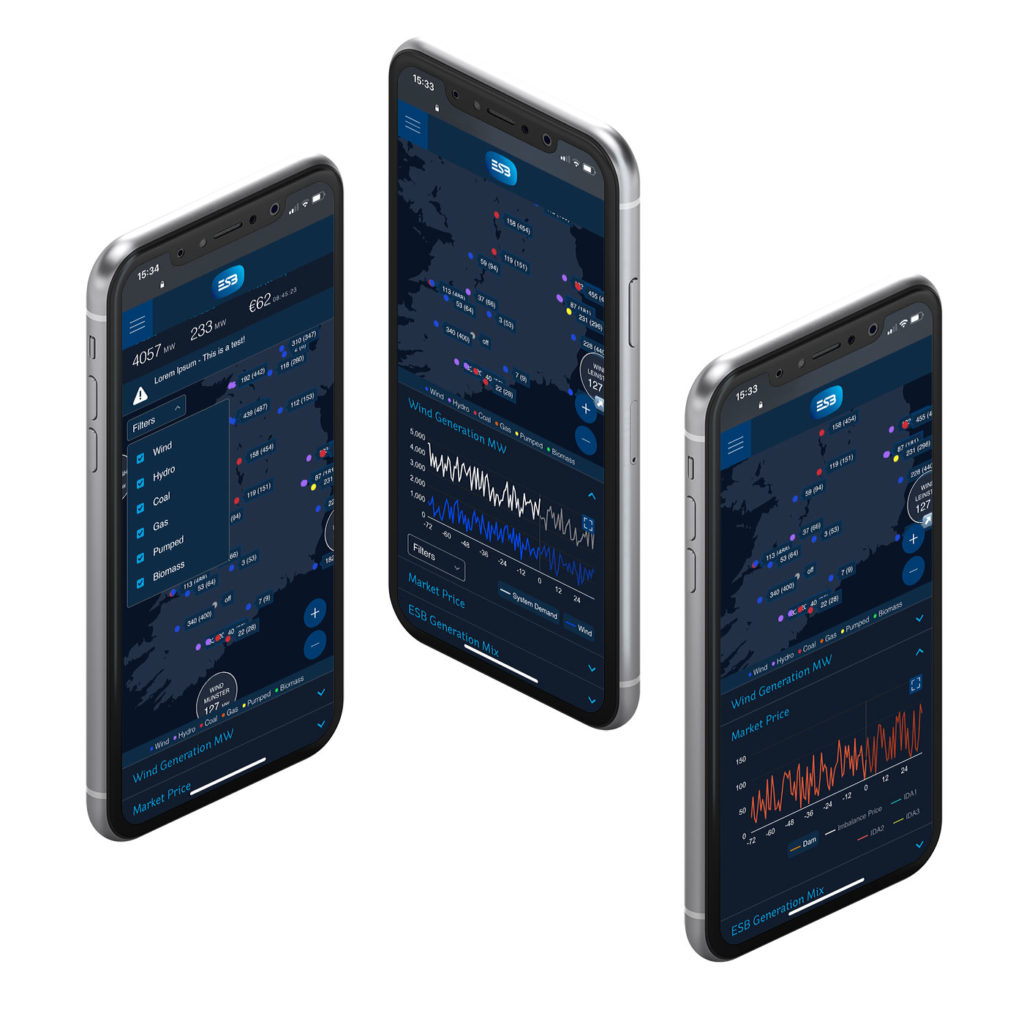

Everyday across Ireland and the UK, ESB Generation and Trading manage, monitor and trade energy from 9 hydro stations, 10 thermal stations and 18 wind farms. Prior to RTV, Station Managers would gather data using a variety of interfaces and tools, then aggregate the information before making decisions.
The data was not available in real-time, graphs and dashboards were in many different formats thus time consuming to analyse as a whole, and not all generation sources such as wind could be visualised.

01. Overview & Summary
Visualising Data
Empowering Station Managers.
WONDR was tasked with improving operational and financial efficiencies by developing a user-friendly, centralised go-to data visualisation hub in ESB Generation that: facilitated business collaboration, consolidated all data sources, enabled informed, data driven business decisions and responded to operational and commercial challenges.
02. LAB+ Rapid Research & Design
Collaboration &
Communication.
Through collaboration, product definition, user research, rapid design and development, WONDR developed a user-friendly, centralised go-to data visualisation hub in ESB Generation Trading. Working closely with all stakeholders, plant managers and traders, we scoped user, technology and business requirements in order to establish clear processes, KPIs and deliverables.
The team was purposely kept tight and focused to ensure a high level of understanding and continuity.
During the LAB+ Discovery and Definition phase the design teams engaged all stakeholders, holding many sessions to gather requirements and outline the project.
-
Defined team costing of UX/UI and ESB resource
-
Dedicated phase using UX design to define the project
-
User research and site visit
-
MoSCoW and Minimum Viable Product (MVP) definition for release
-
UX prototype
-
User testing and analysis
-
UX refinement and sign off
Anna Doran ESBWe built a solid team and we all know our roles so it made it easier to build something fast that has worked and being held in high regard by senior management.
Product Owner
03. CRAFT Design
Agile Design.
Accelerated Delivery.
We employed agile to deliver UX and UI sprints based on MVP release stories. We user tested with actual plant managers, engineers, traders and lead stakeholders to validate ideas before building them.
To enable rapid delivery and iterations, we created a UI style library.

Donal Brogan ESB Generation & TradingRTV allows plant managers to update themselves on the commercial position of the plant in a clear, quick, visual & accurate way.
Performance Application Specialist

04. BUILD Development & Testing
Providing Clarity.
Delivering Consistency.
Once UX and UI deliveries were completed we created HTML templates, a components library and data structures to ensure everything was documented to facilitate backend development handover and integration.
This covered static HTML templates with Ajax interactions for API endpoint using JSON data structure examples for easy integration. A reasonable ESB dark themed toolkit for rapid development of future pages and functionalities was supplied. Along with this a frontend resource was made available for frontend QA to work in Development Sprints to ensure quality control. Finally we documented everything in Confluence for release to help the Development teams pick up on projects.

💶
Significant Savings
🏆
Benchmark Product Process
🕑
Delivered On-Time & On-Budget
Since the first release and proved success of the RTV application, the business has worked on consolidating and visualising several downstream data sources onto the RTV application, to act as a single source of truth for the business.
Owing to a robust Design System and HTML toolkit, these new features can be integrated and implemented with greater efficiency of both cost and time resources.
Find Out More
If you would like to learn more about the ESB Realtime Visualisation project or speak to us about a commission please contact:
_